
The story, methods and technologies behind context charting
In this short article, I try to informally explain how I got to we now call context charting and how it relates to existing methods and technologies.
Finding a way to utilize knowledge graphs for enhanced note-taking
It all started during my PhD in ontology visualization when I had a lightbulb moment: what if we applied the same visualization techniques we use for complex knowledge graphs to everyday note-taking?
I was intrigued by how ontologies and knowledge graphs could represent complex information, and I wondered if this approach could revolutionize how we organize our thoughts and research. The idea was to create a tool that would combine the best of both worlds - the structured exploration of knowledge graphs with the flexibility of note-taking.
Most note-taking tools at the time were either too rigid or too chaotic. I wanted something that could capture relationships between ideas naturally while building an enriched knowledge base over time. This vision ultimately led to what would become the foundation of Contextminds.
Coming across concept mapping
During my research into knowledge visualization methods, I stumbled upon concept mapping. It was very similar to what I had in mind, but without the knowledge graph support. Concept mapping offered a structured yet visual way to represent knowledge that aligned perfectly with what I was trying to achieve.
I also realized that building an interlinked knowledge graph of notes was essentially the same principle behind the Zettelkasten method that many writers and researchers swear by. The difference was that I wanted to make these connections visual and interactive.
My approach became a form of concept mapping backed by a database, which evolved into the original Contextminds implementation. It provided a way to visually organize thoughts while maintaining the underlying connections that make knowledge graphs so powerful.
Marketing knowledge graph-backed concept mapping to teachers
With a working prototype in hand, I decided to target educators first. Teachers seemed like the perfect audience - they need to organize complex information and present it in accessible ways to students. I trained hundreds of teachers on how to use concept mapping in their classrooms and for their lesson planning.
The feedback was generally positive. Teachers appreciated having a visual way to organize curriculum materials and demonstrate connections between concepts to their students. Concept mapping has decades of research backing its effectiveness as a learning tool, which gave credibility to my approach.

Discovering drawbacks and limits of concept mapping
However, as I worked with more teachers, I began to see limitations. Traditional concept mapping can be surprisingly rigid - there are specific rules about how concepts should be connected, labeled, and organized. Many teachers found it difficult to learn and implement correctly, and students often struggled even more.
The learning curve was steeper than I had anticipated. While concept mapping is powerful, its technical nature created adoption barriers. I started wondering if there might be other audiences who could benefit from knowledge graph visualization without needing to master all the formal aspects of concept mapping.
Emerging LLM AI changing the playing field
Then came the AI revolution with large language models. This changed everything! I realized that content writers could benefit tremendously from knowledge graph visualization tools - perhaps even more than educators. They also had more budget to spend on productivity tools than schools did.
The emergence of AI writing assistants created a need for tools that could help organize research and plan content before turning it over to AI for drafting. I saw an opportunity to pivot Contextminds toward content creation, specifically for mapping the context needed to create well-researched, coherent content.
Adjusting the tool and method for content writers
Content writers needed a more relaxed visual method than traditional concept mapping. They wanted flexibility without sacrificing organization. This led me to develop what we now call "context charting."
Adding the option to create lists and hierarchical lists (outlines) on the map
First, I added the ability to group items into simple lists within the visual space. This was a game-changer! Writers could collect related ideas without needing to define precise relationships between every single item.
I then extended this to support hierarchical lists, essentially creating visual outlines. This bridged the gap between traditional outlining (which writers were familiar with) and the spatial organization that makes knowledge graphs so powerful.
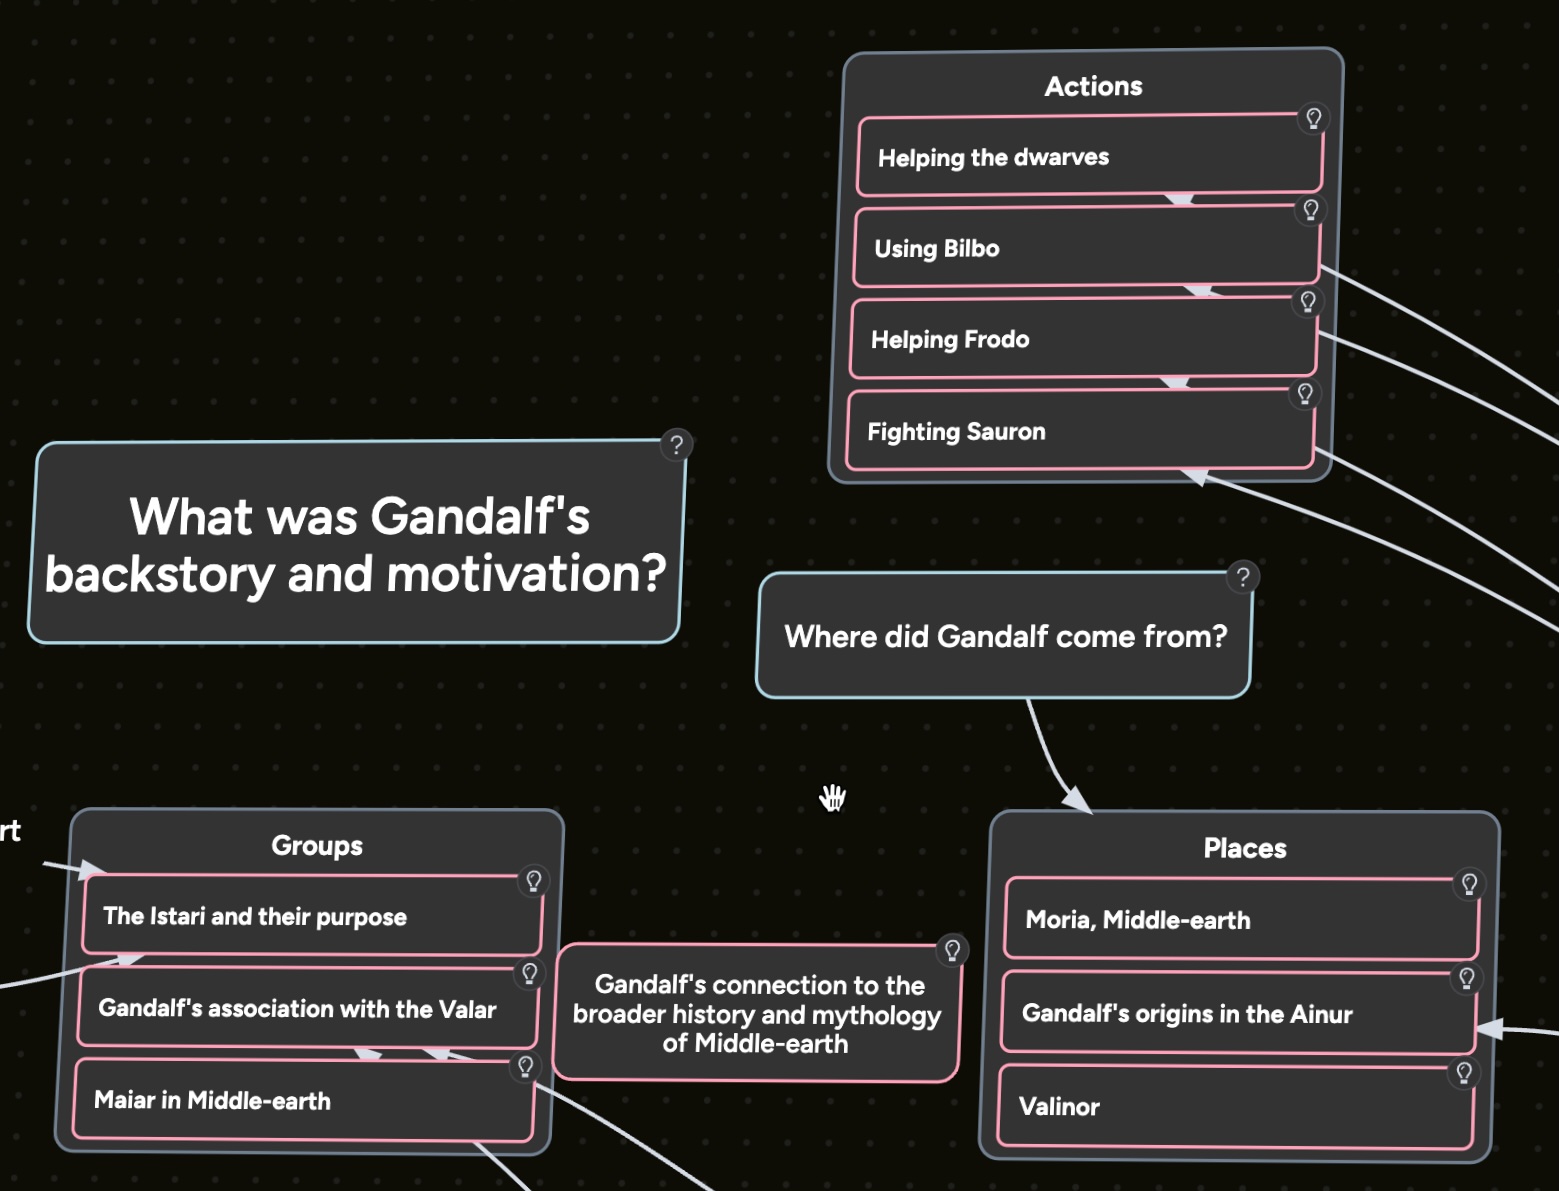
Defining item types for specifying the role of each item in the map
Another innovation was adding item types to define the role of each element on the map. This wasn't just helpful for users - it was essential for integrating with AI tools. By specifying whether something was a question, evidence, idea, or conclusion, the AI could better understand the context and generate more relevant content.

Adjusting the method further to better support tracking research
Finally, I relaxed many of the rigid rules of concept mapping to create a method that better supported research tracking. Context charting principles emerged that preserved the benefits of visual organization while making the experience more intuitive for content creators.
Context charting became about creating a visual space where ideas could be organized, connected, and hierarchically arranged as needed - with none of the strict rules that made concept mapping difficult to adopt.
The result? A method that works beautifully with common tools like Miro and Google Docs, and integrates seamlessly with AI assistants like Copilot. It helps writers organize their research visually, then leverage that organization to brief AI tools for better content creation.
So that's my journey from ontology visualization researcher to the creator of context mapping - a visual research and note-taking method designed specifically for content creation in the age of AI.
Table of contents

Start a free 14-day
trial today — no strings attached!
.svg)
Unlimited maps & topic suggestions to fuel your content creativity.
1 workspace so that you can easily share your maps
1k GPT credits, 1k keywords and 6k web results to power up your content ideation.
Request a demo
Learn to use AI for SEO topic ideas
See tips and tricks to make you a power user
Understand Contextmind's plans, pricing, and ROI

